
Facts & Figures: 2023
Table of Contents
All data is provided by the Office of Planning and Analysis.
Students by Country of Origin (2023)
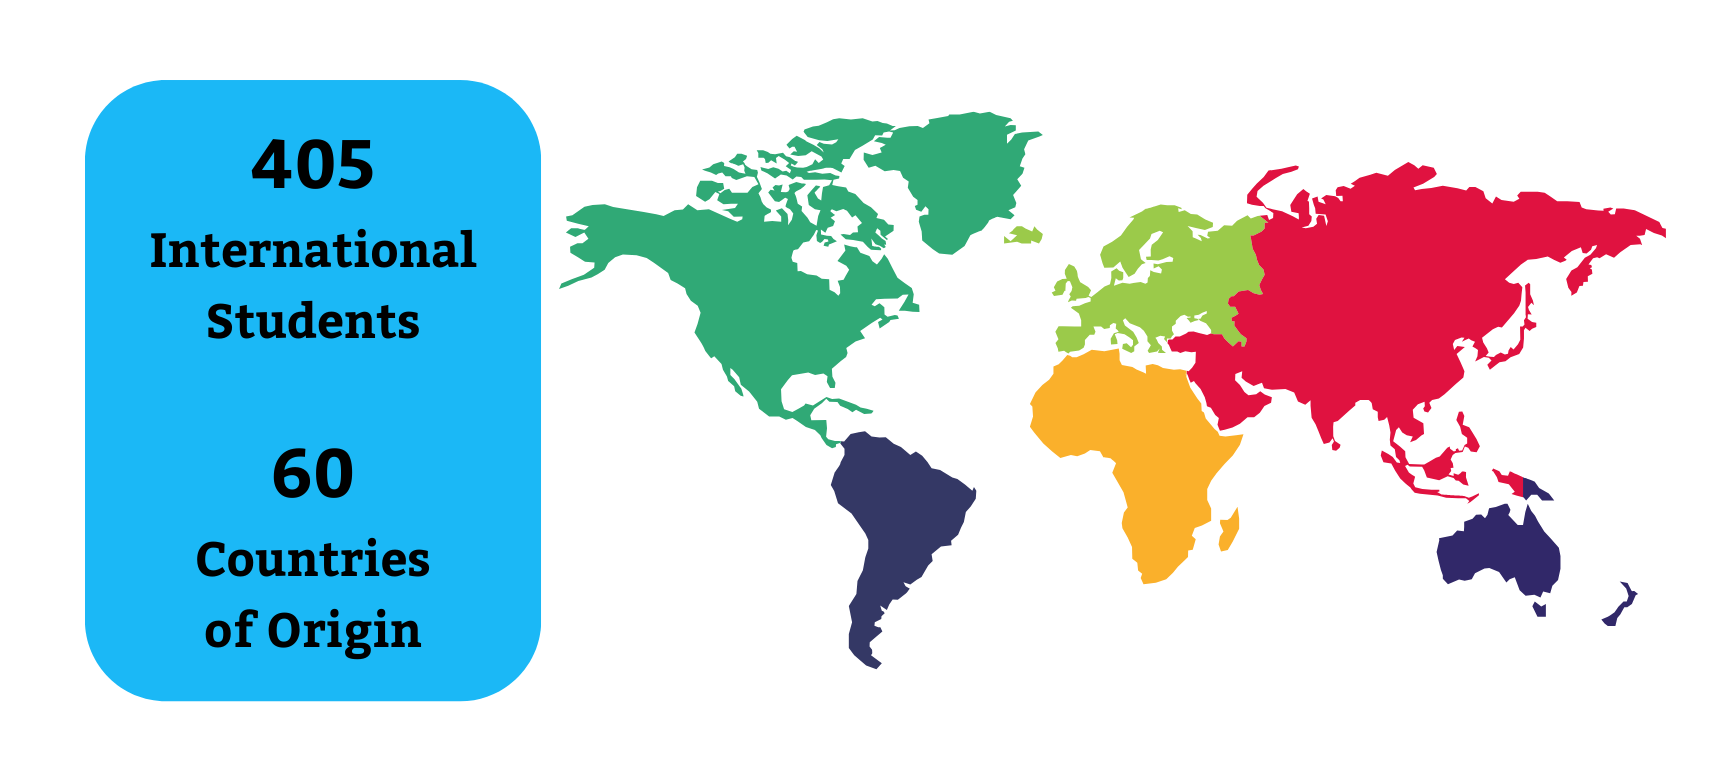
The Office of International Programs serves as Montana State University’s international gateway by facilitating connections, programs and experiences that bring the world to Montana and Montana to the world. To learn more about the Office of International Programs, visit montana.edu/international.
Students by Race & Ethnicity (Duplicated Data*, 2023)
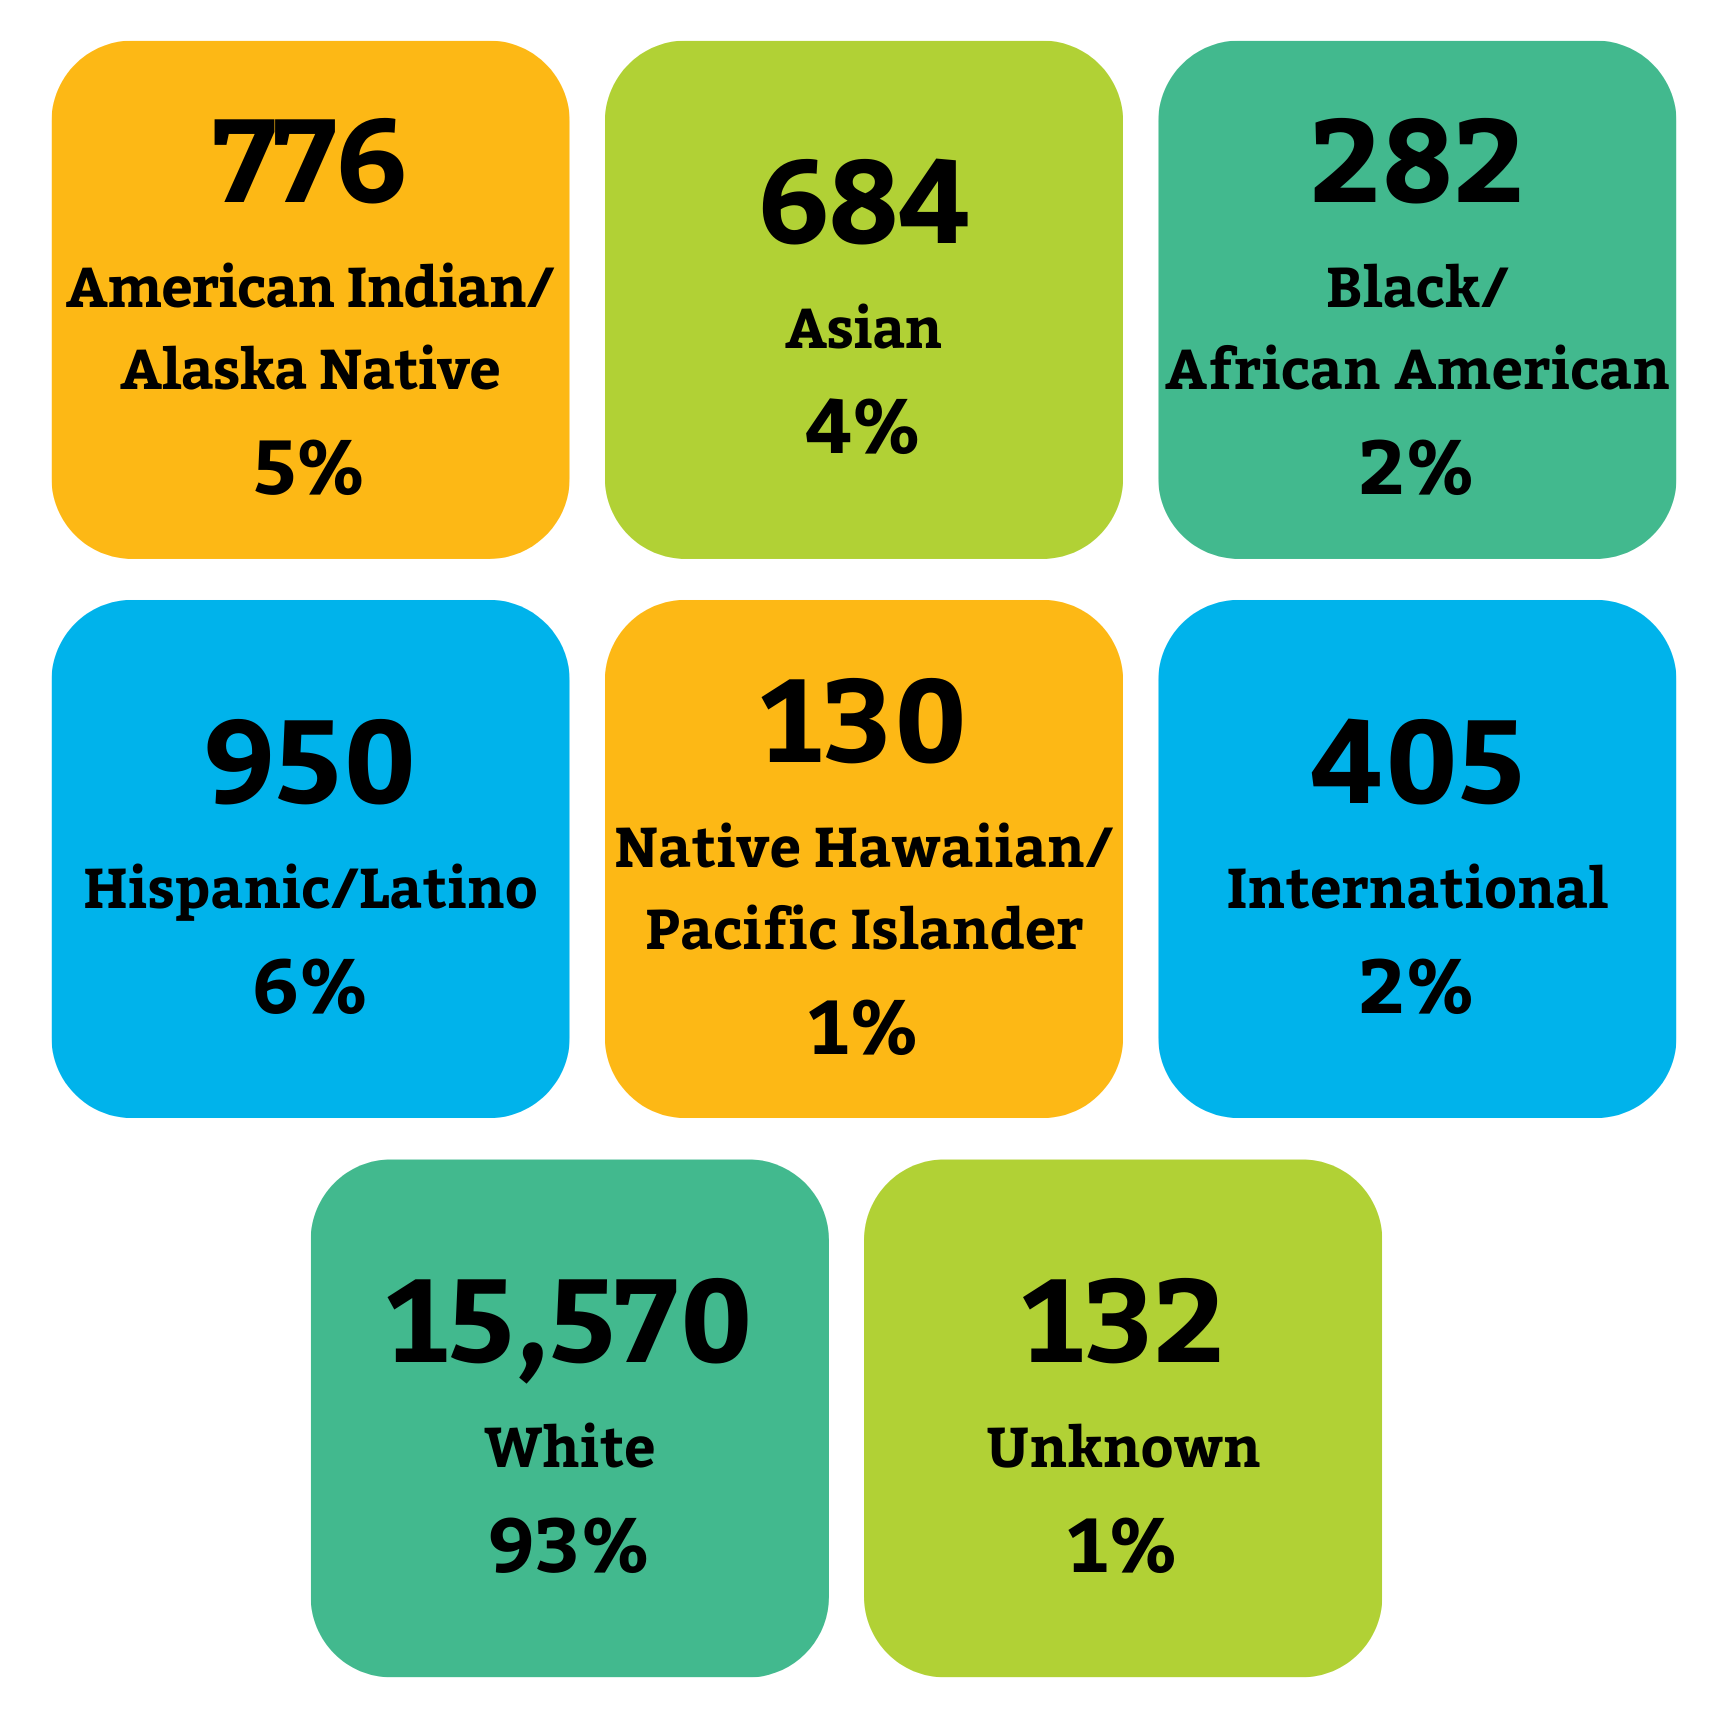 Image text: 776 American Indian/Alaska Native (5%), 684 Asian (4%), 282 Black/African
American (2%), 950 Hispanic/Latino (6%), 130 Native Hawaiian/Pacific Islander (1%),
405 International (2%), 15,570 White (93%), and 132 Unknown (1%).
Image text: 776 American Indian/Alaska Native (5%), 684 Asian (4%), 282 Black/African
American (2%), 950 Hispanic/Latino (6%), 130 Native Hawaiian/Pacific Islander (1%),
405 International (2%), 15,570 White (93%), and 132 Unknown (1%).
As a land grant university, MSU is committed to developing and sustaining a culture of inclusion, social justice, and diversity. A central goal in MSU's strategic plan is to broaden access for underrepresented populations and increase academic success for all students through excellence in undergraduate education. To learn more about MSU's strategic plan visit montana.edu/strategicplan.
*These are duplicated data (meaning students had the option to identify with more than one race/ethnicity) provided by the Office of Planning & Analysis. For unduplicated data and other student demographics, visit https://www.montana.edu/opa/students/index.html.
Students by Gender Identity (2023)
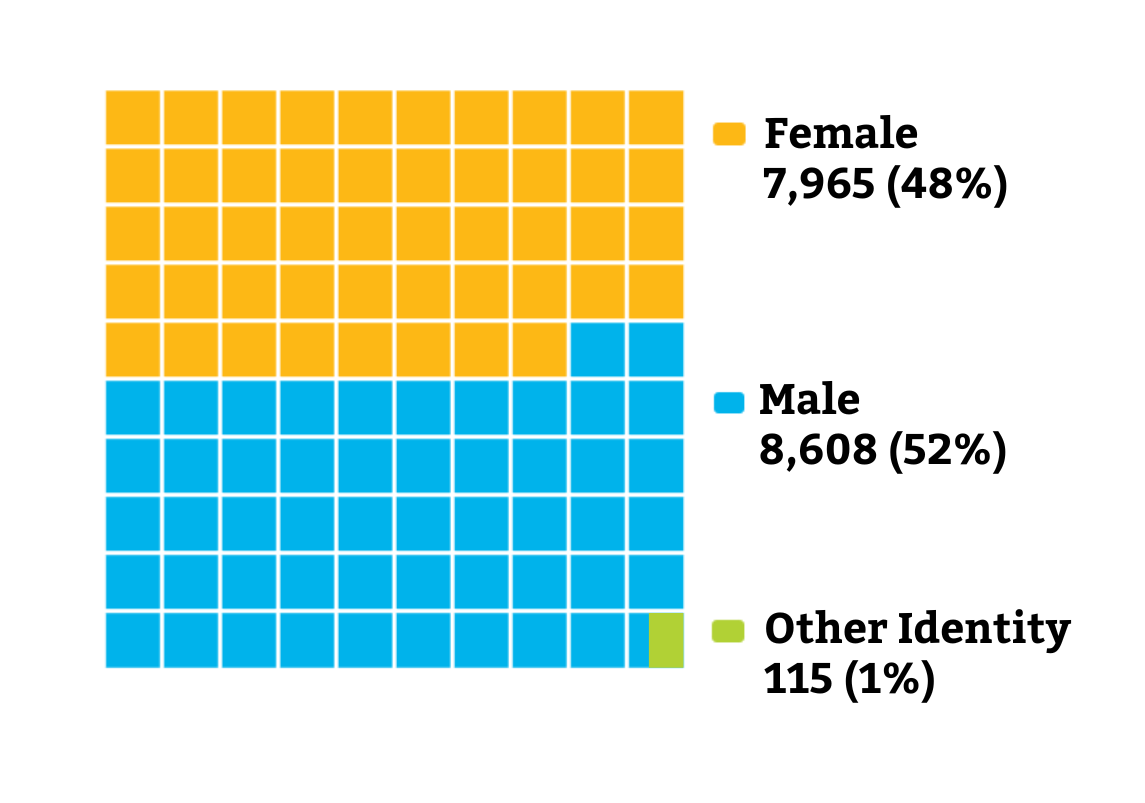 Image text: 7,965 Female (48%), 8,608 Male (52%), 115 Other Identity (1%).
Data comes from students self-identifying their gender in categories defined within the Banner system.
For additional institutional data and other student demographics, visit https://www.montana.edu/opa/students/index.html.
Faculty by Race & Ethnicity (Duplicated Data*, 2023)
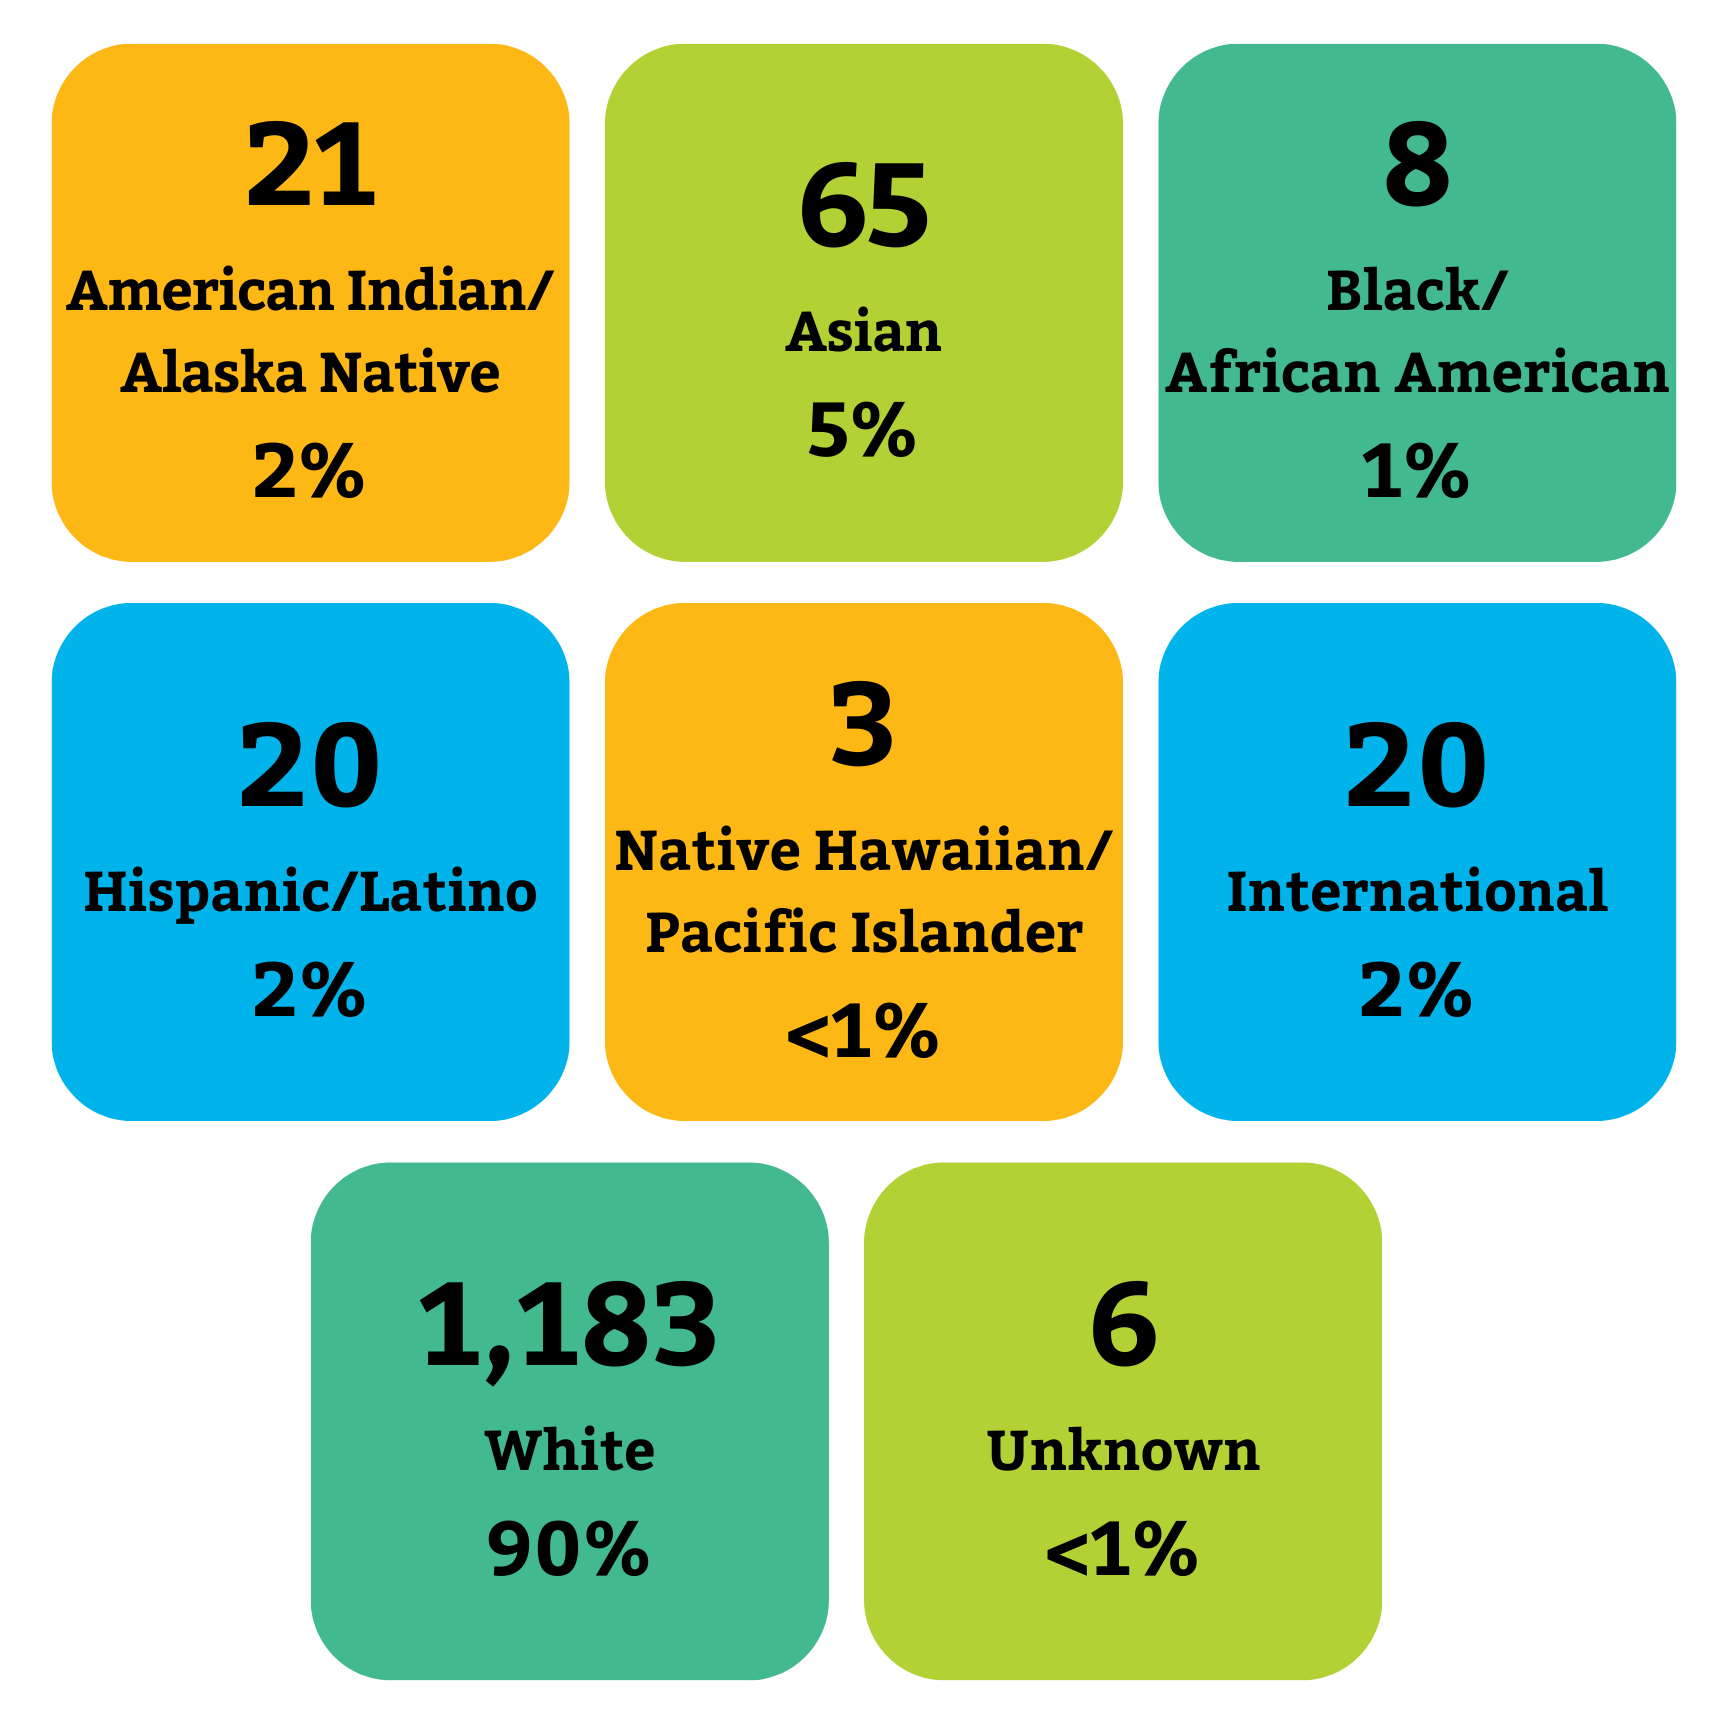 Image text: 21 American Indian/Alaska Native (2%), 65 Asian (5%), 8 Black/African
American (1%), 20 Hispanic/Latino (2%), 3 Native Hawaiian/Pacific Islander (<1%),
20 International (2%), 1,183 White (90%), 6 Unknown (<1%).
Image text: 21 American Indian/Alaska Native (2%), 65 Asian (5%), 8 Black/African
American (1%), 20 Hispanic/Latino (2%), 3 Native Hawaiian/Pacific Islander (<1%),
20 International (2%), 1,183 White (90%), 6 Unknown (<1%).
Montana State University has been chosen to participate in a new national initiative designed to recruit and retain a more inclusive, diverse faculty in science, technology, engineering and math fields. Fifteen public research universities were selected to participate in the inaugural three-year effort to help those schools reform their recruitment, hiring and retention practices. The Aspire Alliance’s Institutional Change (IChange) Network aims to ultimately increase the participation and success of undergraduate STEM students from underrepresented groups. Aspire is funded by the National Science Foundation. It is led by the Association of Public and Land-grant Universities and the Center for the Integration of Research, Teaching, and Learning at the University of Wisconsin–Madison with the involvement of several additional universities. Over the next three years, MSU will be engaging in an institutional effort to recruit and retain a more inclusive, diverse faculty in STEM fields.
*These are duplicated data (meaning faculty had the option to identify with more than one race/ethnicity) provided by the Office of Planning & Analysis. For unduplicated data and other faculty demographics, visit http://www.montana.edu/opa/facultystaffindex/index.html.
Faculty by Gender Identity (2023)
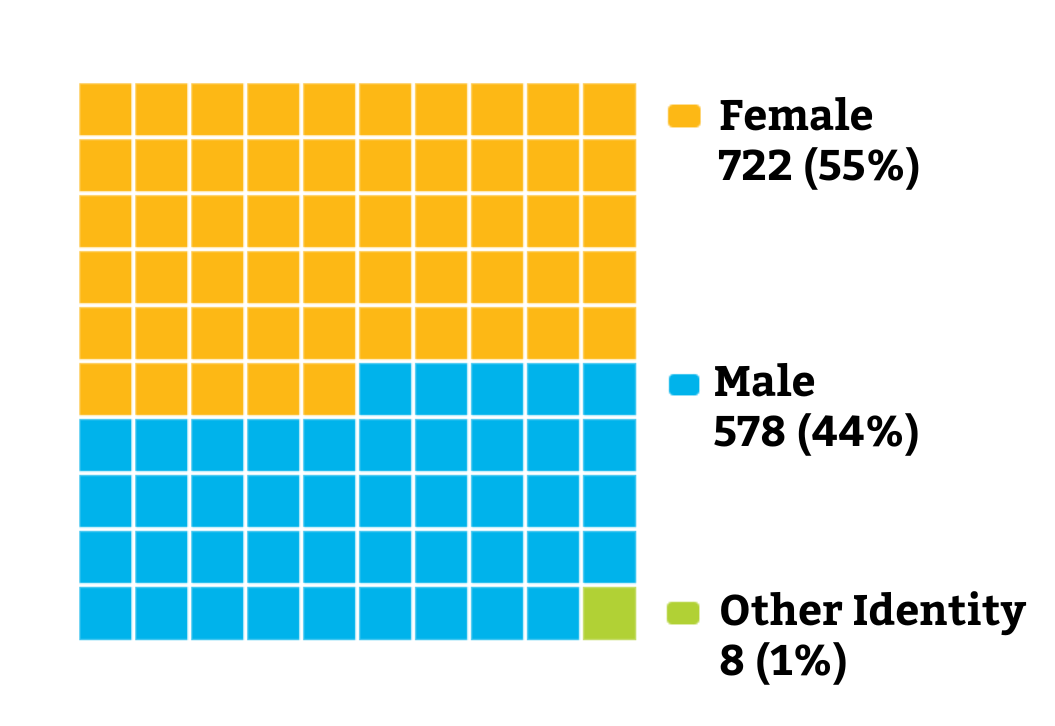
Image text: 722 Female (55%), 578 male (44%), 8 Other Identity (1%).
Data comes from faculty self-identifying their gender in categories defined within the Banner system.
Under the NSF ADVANCE grant from 2012-2017, MSU made great strides in diversifying faculty, with a particular focus on women faculty in the STEM fields. This commitment to diversifying faculty successfully yielded an increasing number of women faculty. Impacts can be seen, for example, in the Norm Asbjornson College of Engineering where the number of women faculty has steadily risen from 12% in 2012 to 27% in 2019.
For additional institutional data and other faculty demographics, visit http://www.montana.edu/opa/facultystaffindex/diversity/Faculty_Diversity.html
Staff by Race & Ethnicity (Duplicated Data*, 2023)
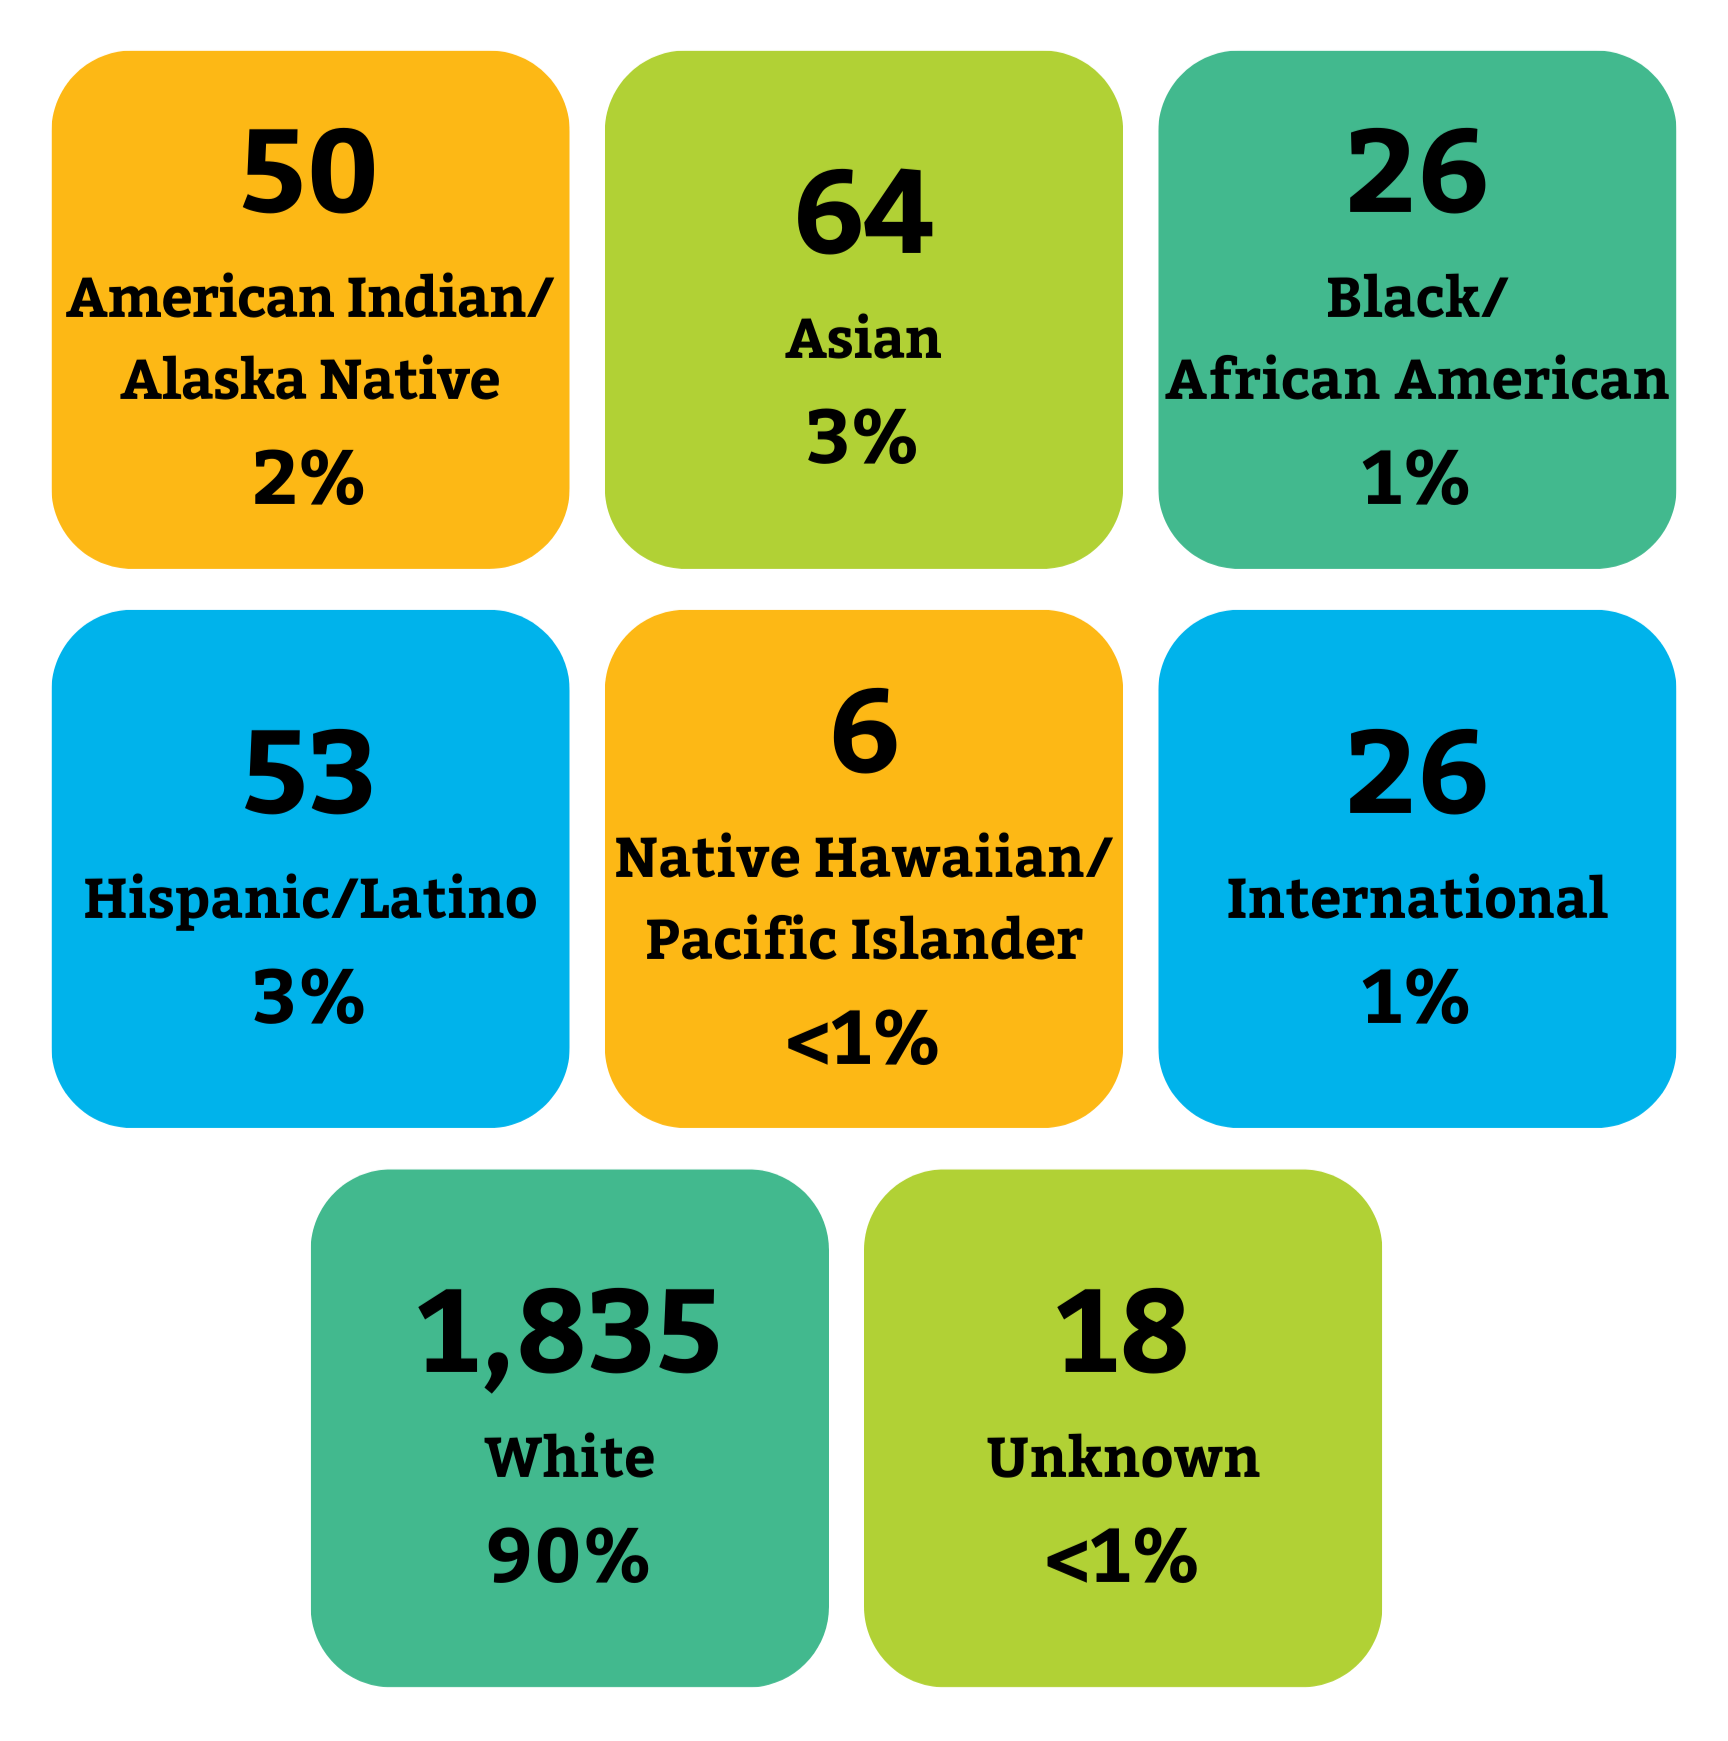 Image text: 50 American Indian/Alaska Native (2%), 64 Asian (3%), 26 Black/African
American (1%), 53 Hispanic/Latino (3%), 26 International (1%), 6 Native Hawaiian/Pacific
Islander (<1%), 1,835 White (90%), 18 Unknown (<1%).
Image text: 50 American Indian/Alaska Native (2%), 64 Asian (3%), 26 Black/African
American (1%), 53 Hispanic/Latino (3%), 26 International (1%), 6 Native Hawaiian/Pacific
Islander (<1%), 1,835 White (90%), 18 Unknown (<1%).
Montana State University considers the diversity of its students, faculty and staff to be a strength and critical to its educational mission. In 2017, MSU published a Diversity and Inclusion Framework Report which was written after hundreds of MSU students, faculty and staff provided feedback at a series of diversity summits and charrettes. This Framework identifies recruiting, promoting the success of, a fostering a sense of belonging for a diverse student body, faculty, and staff as a goal towards which the university is working. To learn more about Diversity and Inclusion Framework visit montana.edu/provost/d_i.html.
*These are duplicated data (meaning staff had the option to identify with more than one race/ethnicity) provided by the Office of Planning & Analysis. For additional institutional data on faculty and staff, visit http://www.montana.edu/opa/facultystaffindex/index.html.
Staff by Gender Identity (2023)
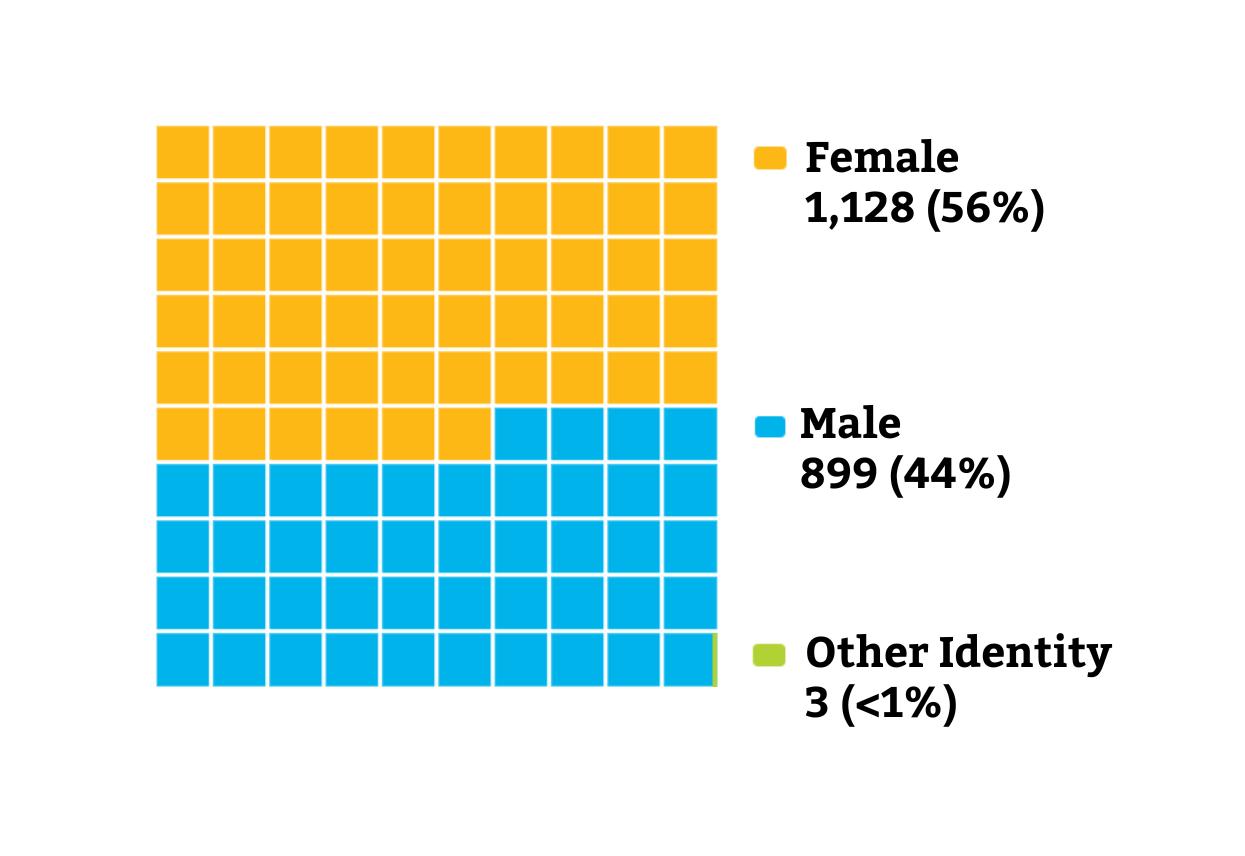 Image text: 1,128 Female (56%), 899 Male (44%), 3 Other (<1%).
Data comes from staff self-identifying their gender in categories defined within the Banner system.
Enrollment and Retention
Enrollment Among Undergraduate Population
Download the enrollment information as a PDF